A famous publishing company rolled out a tricky OKRs implementation with support from Quantive and one of our expert partners.
The challenge
OKRs come in many different ‘flavors’ with no two methodologies functioning in the same way. There can be differences in who owns OKRs, whether just leadership or all employees, number of Key Results per person, visibility of ‘sensitive’ OKRs, and even how often they should be reviewed, amongst other things. This can be a real challenge for businesses who are new to OKRs, as there is no one-size-fits-all template.
The biggest challenge for this media company was making sure that OKRs set for every employee were regularly reviewed with managers, and other cross-functional teams, and that these reviews happened with the most up-to-date and correct data, at scale. For a company of many thousands of employees, scalable, effective check-ins were imperative.
The first hurdle was defining clear responsibilities and ownership of OKRs. Employees were divided into 3 main groups, Leadership, who would be responsible for determining the 3 top-level annual OKRs, OKR working groups, who developed quarterly OKRs against annual targets, and Delivery groups, who worked on the delivery of the quarterly OKRs.
The second, bigger challenge, was ensuring that every team had effective monthly check-ins and quarterly reviews to ensure alignment and to take action if any team is blocked or needed support.
Depending on the meeting type, whether Leadership, Working Group, or Delivery Group, the teams would need different sets of data which would need to be prepared in advance. This data would be visualized in software unconnected to their OKRs, screenshotted, and then put into a PowerPoint presentation.
In such a large organization, the above process was incredibly complex to implement, and delays in getting the right data, at the right time, led to inefficient meetings, poor diagnosis of blockers, and OKRs failing.
The solution
After several scoping meetings with our customer, we identified the best solution as custom-made dashboards which combined data from several different software, such as their CRM and ERP data, in combination with OKR progress.
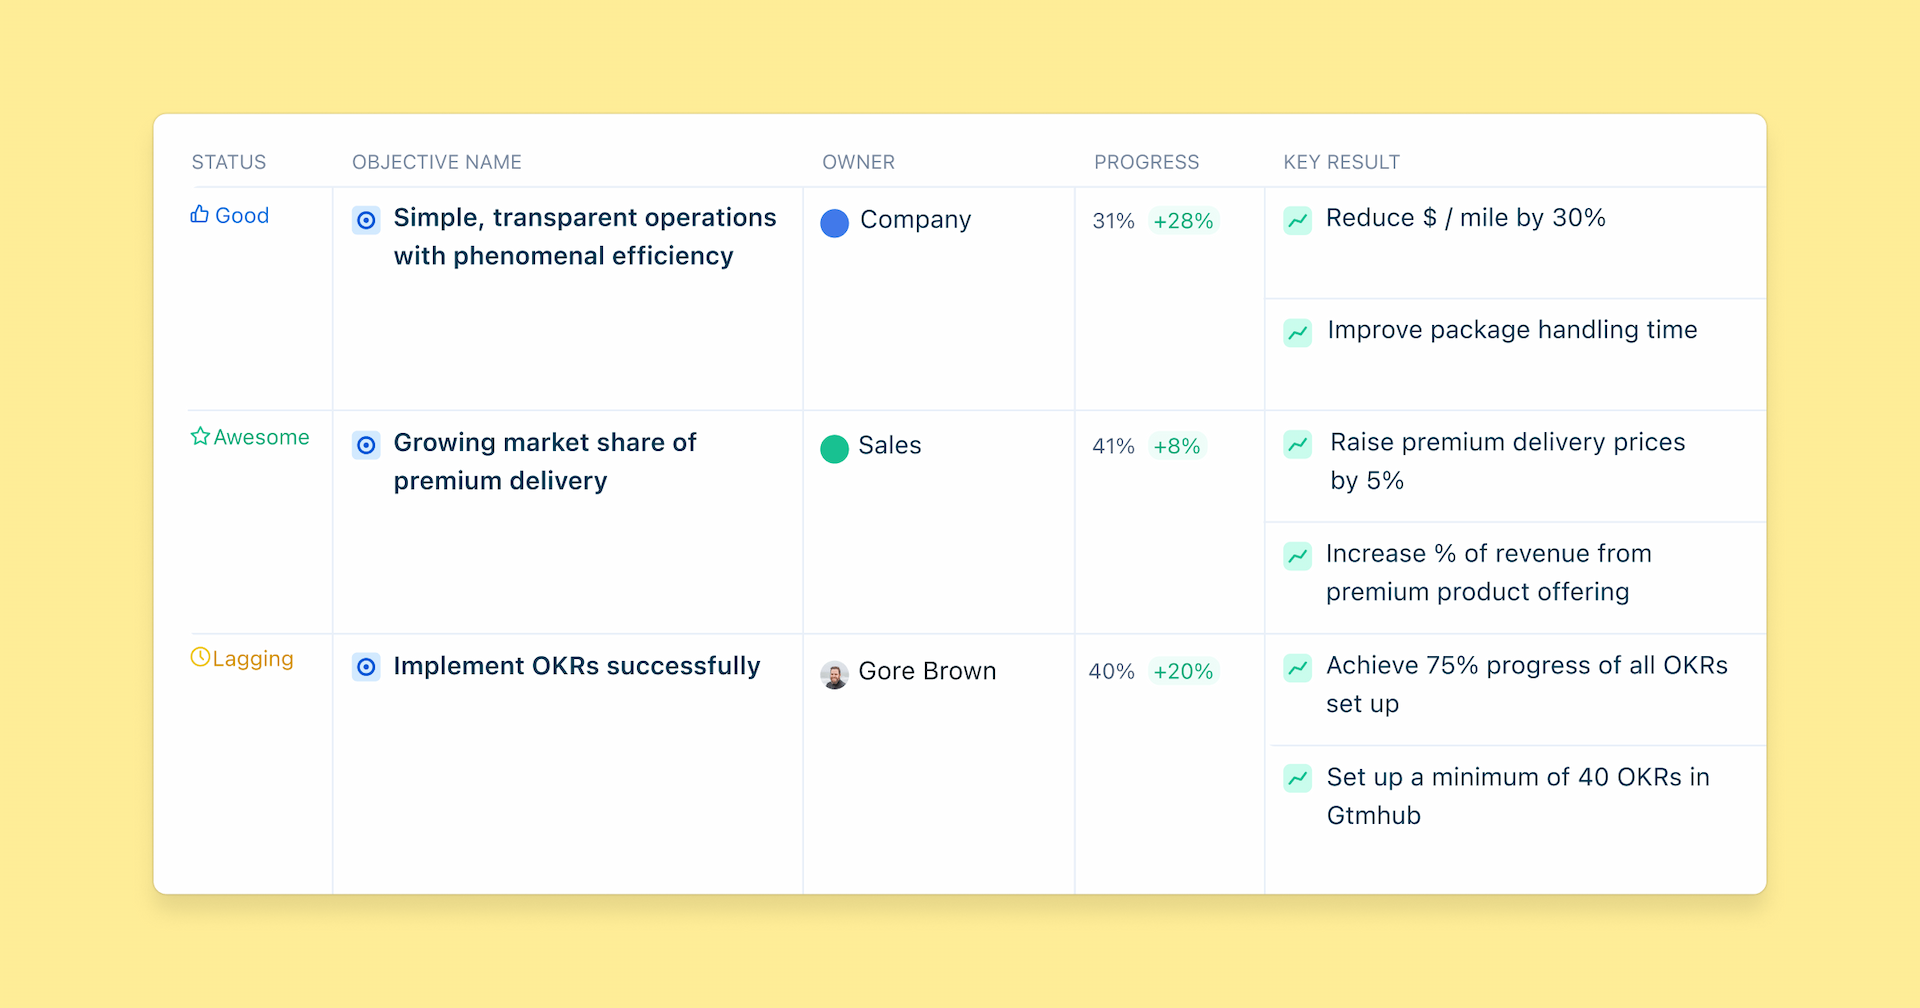
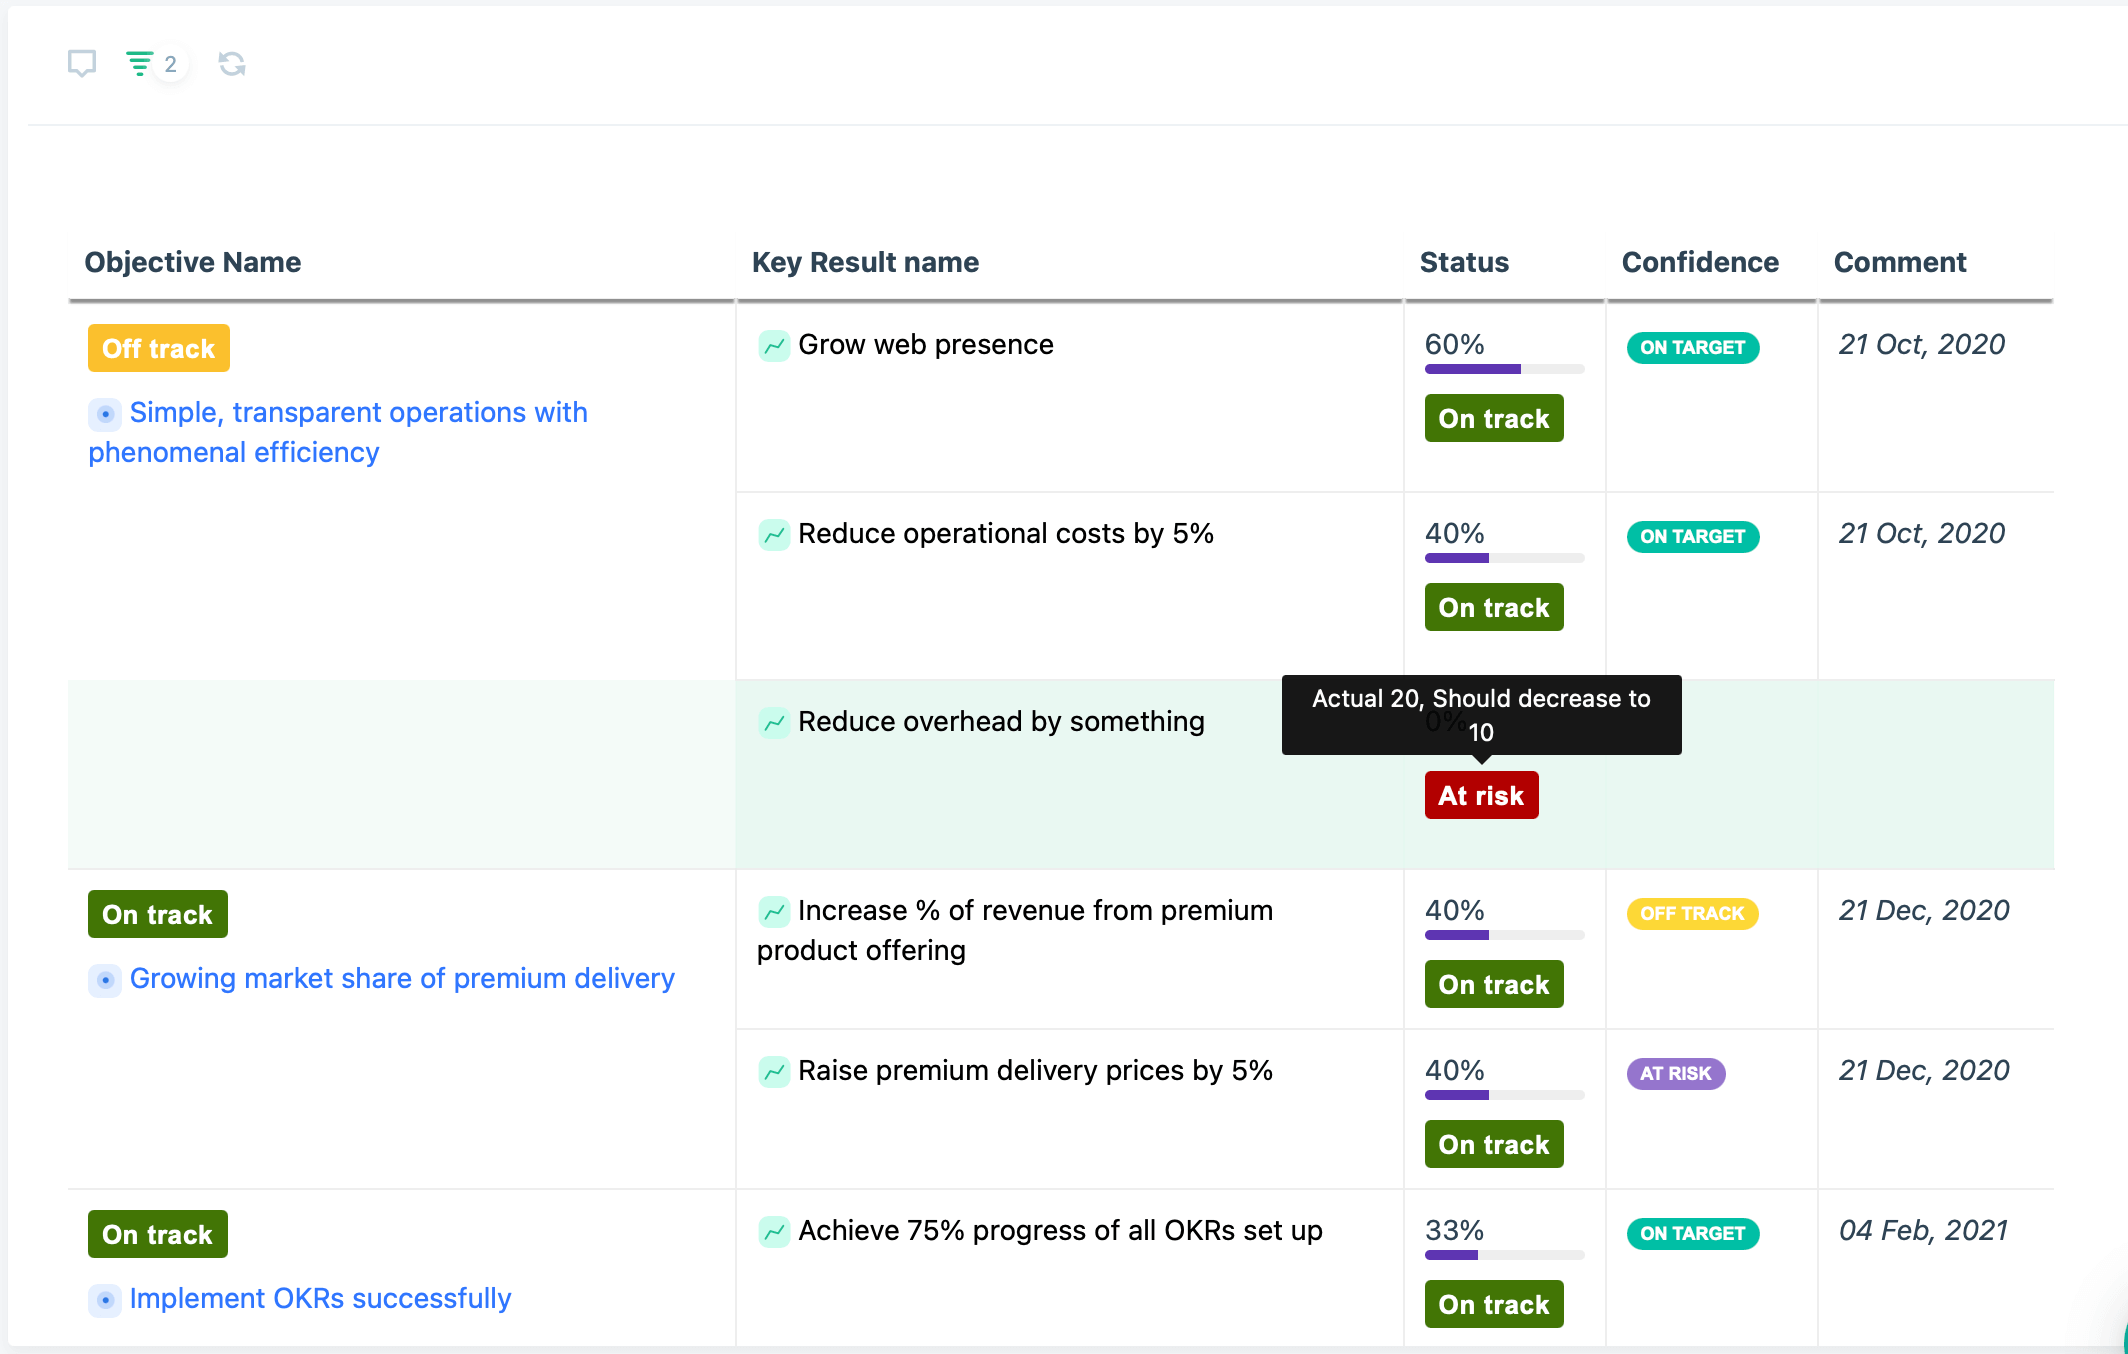
For the Leadership team, we visualized the progress of Annual OKRs in combination with comments on the progress of Key Results for context.
In addition, based on the progress and the expected progress of each OKR, we created a custom metric that populated the status as either on track or not; giving senior managers the opportunity to quickly find out what is working and to take the appropriate course if it is not.
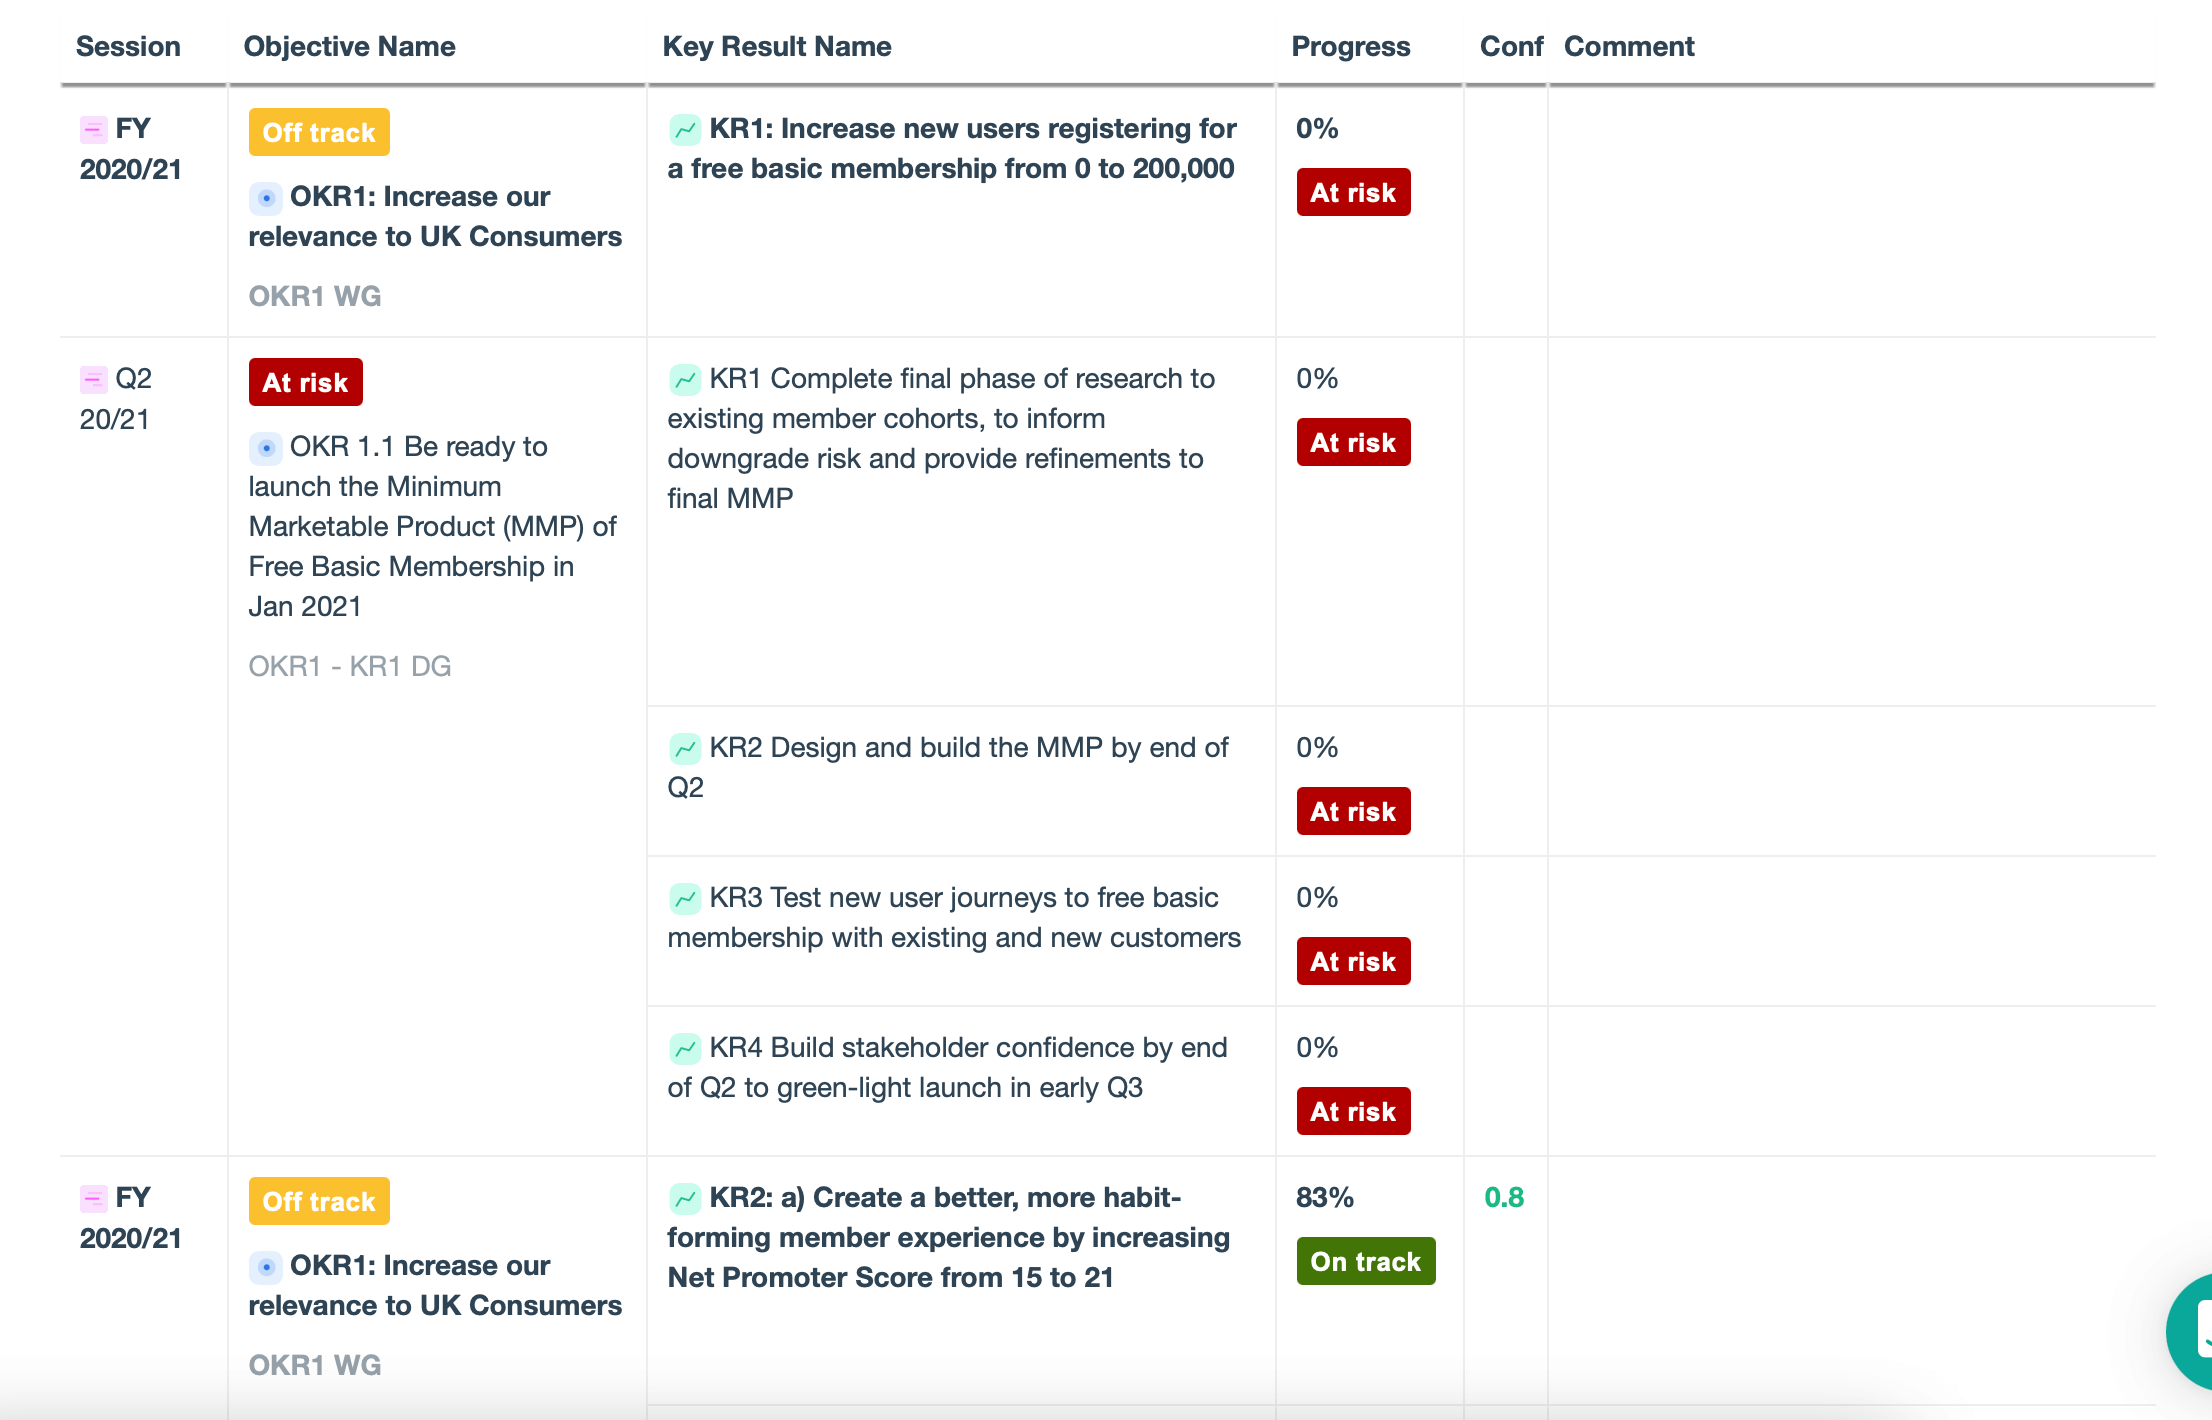
Working Groups needed a different sub-set of data and required illustrations of the relationship between annual and quarterly OKRs as well as progress.
This report was built to be filtered by top-level OKR, to see only their relevant Objectives and to provide a granular drill down into data. Following the same logic as the Leadership Group, an ‘On Track’ status was also included.
A facet of their methodology was that quarterly OKRs could support multiple annual KRs, so to provide clearer visualizations, we introduced an additional field also on the Objective level, which specifies the top-level KRs supported by this Objective.
Delivery Groups were interested in the quarterly OKRs they specifically owned, with additional details around tasks, owners, and comments on updates.
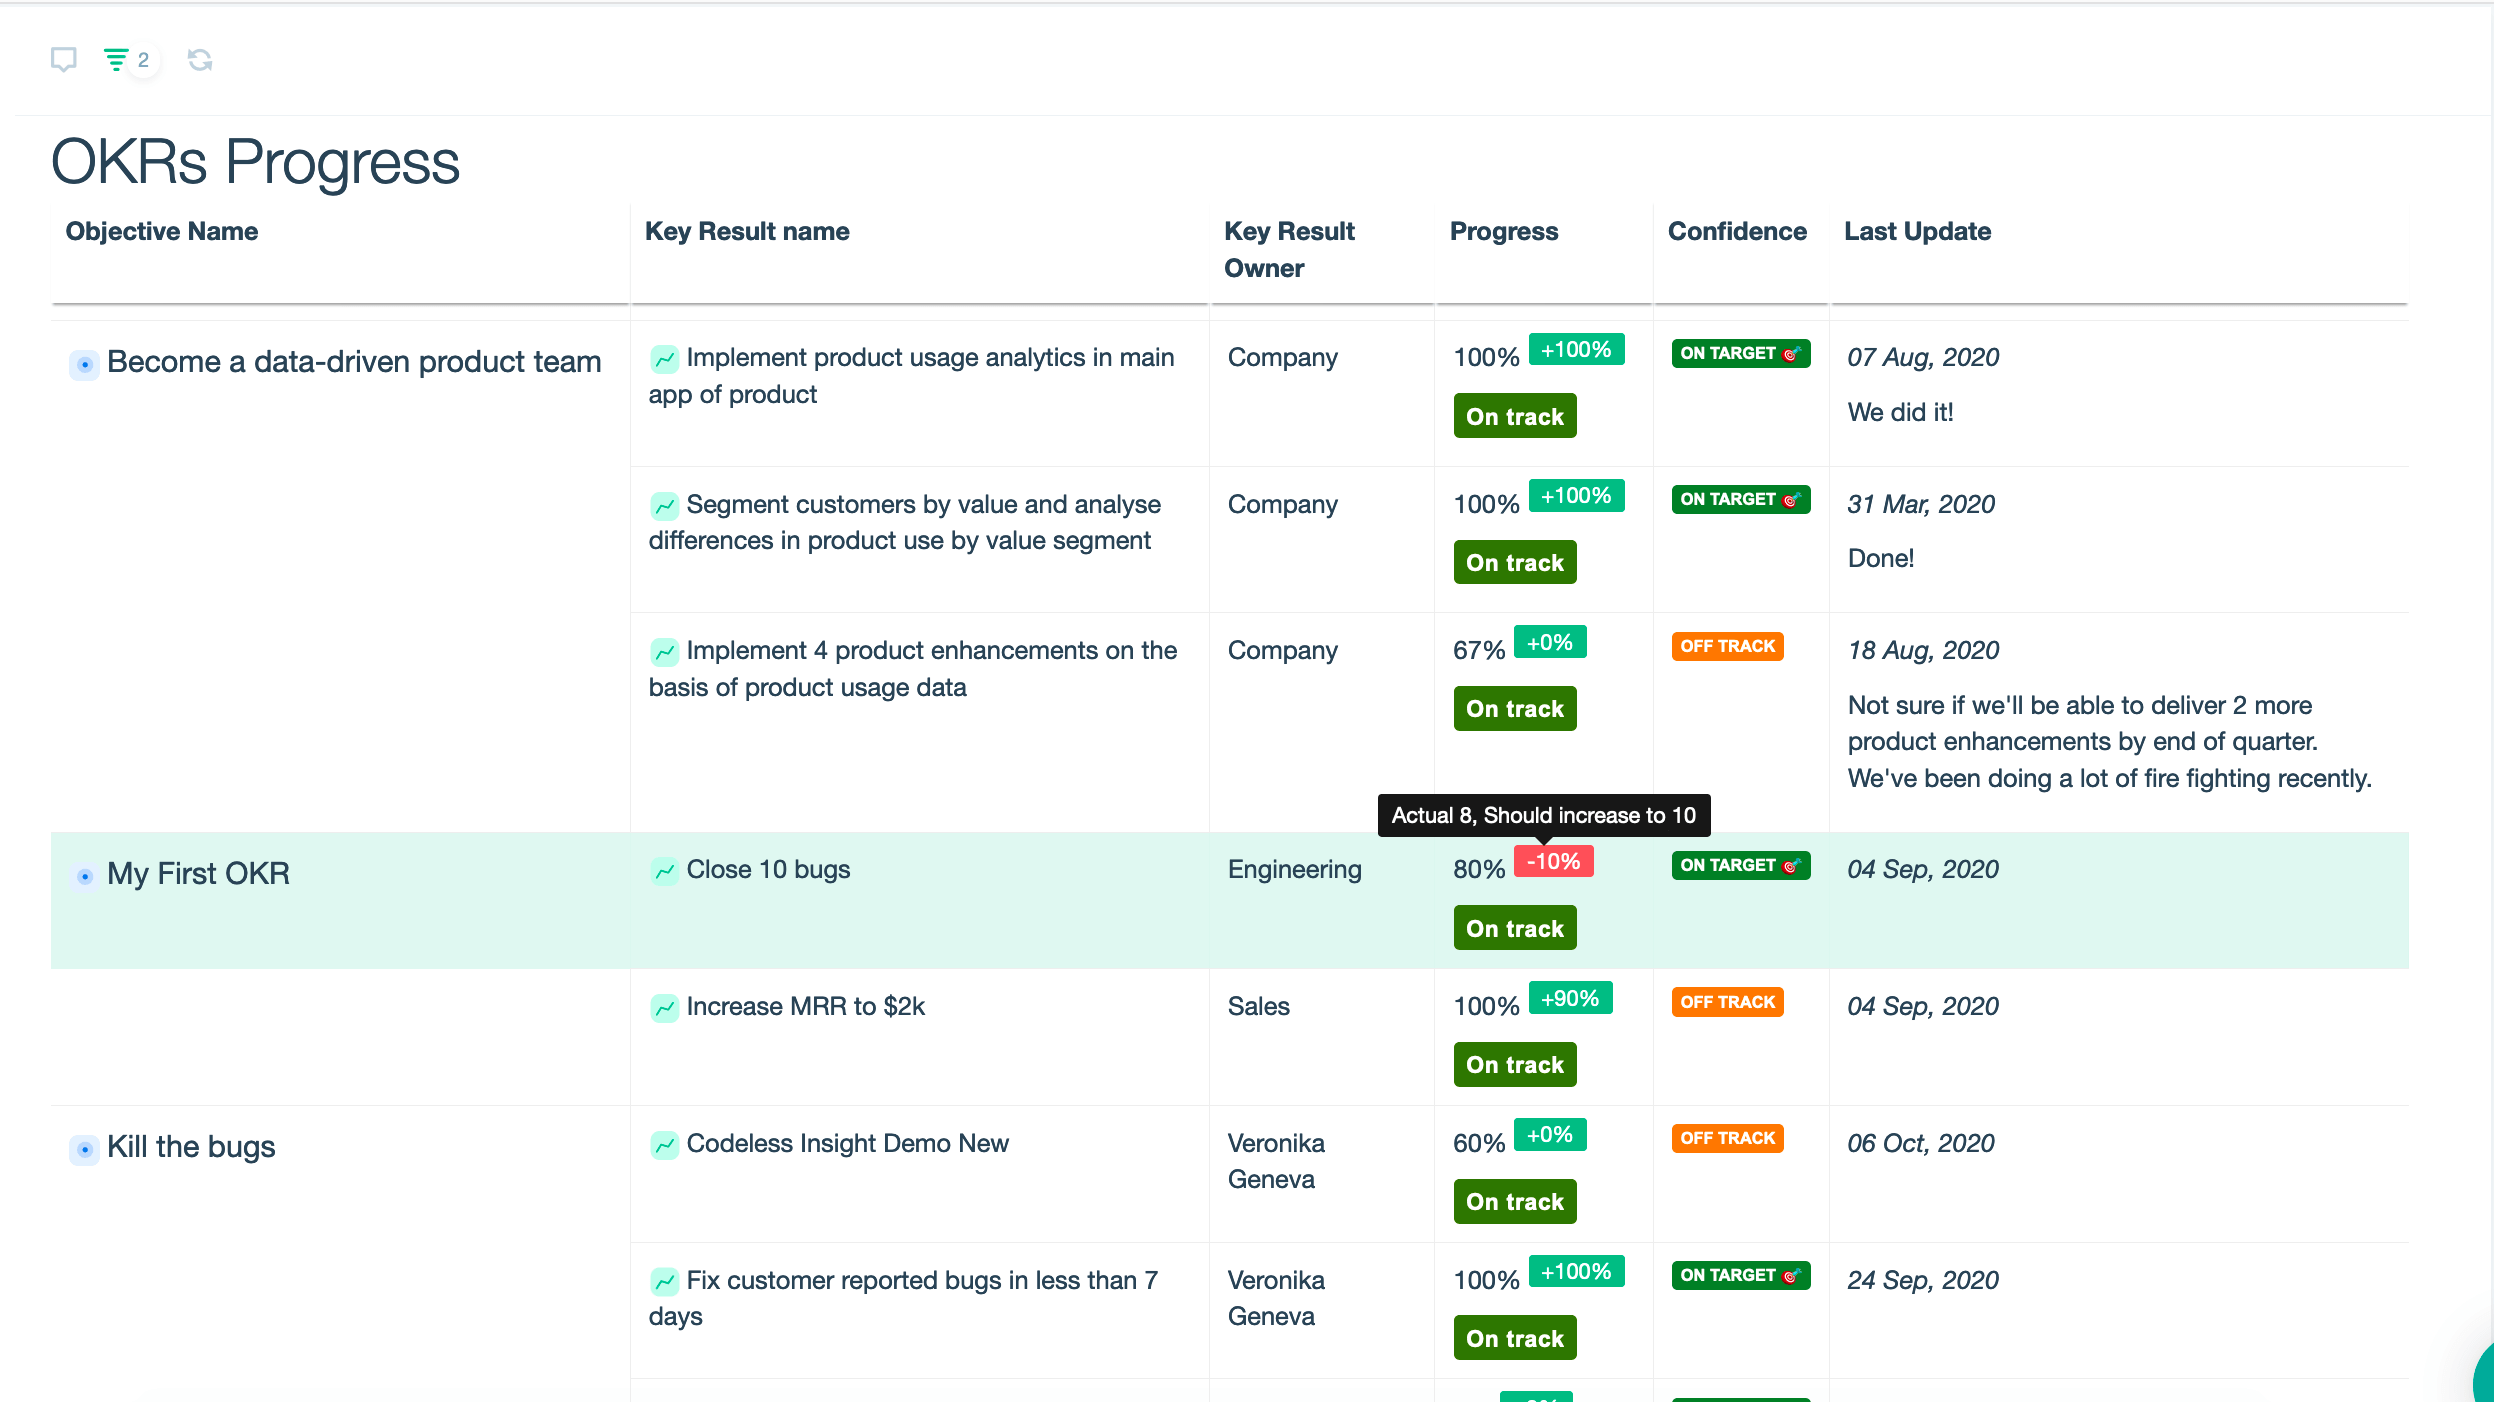
All three dashboards were freely accessed by interested parties in advance of and during meetings, ensuring that data was automatically updated, that the visualizations perfectly expressed the state of play and no time was wasted finding the right data.
The outcome
Our solution made the customer's meetings more focused and structured. We saved them many business hours in preparation for check-ins, immediately providing our customer with accurate information without the arduous creation of new graphics, the removal of creating lengthy PowerPoint decks, and the ability to interrogate live data. In return, employees have more time to deliver outcomes.
Quantive empowers modern organizations to turn their ambitions into reality through strategic agility. It's where strategy, teams, and data come together to drive effective decision-making, streamline execution, and maximize performance.
As your company navigates today’s competitive landscape, you need an Always-On Strategy to continuously bridge the gap between current and desired business outcomes. Quantive brings together the technology, expertise, and passion to transform your strategy from a static plan to a feedback-driven engine for growth.
Whether you’re a visionary start-up, a mid-market business looking to conquer, or a large enterprise facing disruption, Quantive keeps you ahead — every step of the way. From OKR software to OKR consulting, we help you plan and meet your goals. For more information, visit www.quantive.com.