A healthcare software provider gained greater insights and visibility into their eNPS score through a custom integration with SurveySparrow.
The challenge
This Healthtech company really cares about its employees. During covid and the switch to remote working, several issues arose with employees feeling isolated, disconnected, or disengaged. Management decided that they needed to have a better understanding of the causes, as well as a solution to employee dissatisfaction.
They had run multiple employee surveys a year previously, using SurveySparrow, but they had no way to visualize the data in a digestible manner, nor to automatically track the eNPS metric as a KPI. Moreover, having identified problems in the survey, it was very hard for them to act on them in a meaningful way, as they lacked a connection between their eNPS software and strategic planning approach.
The solution
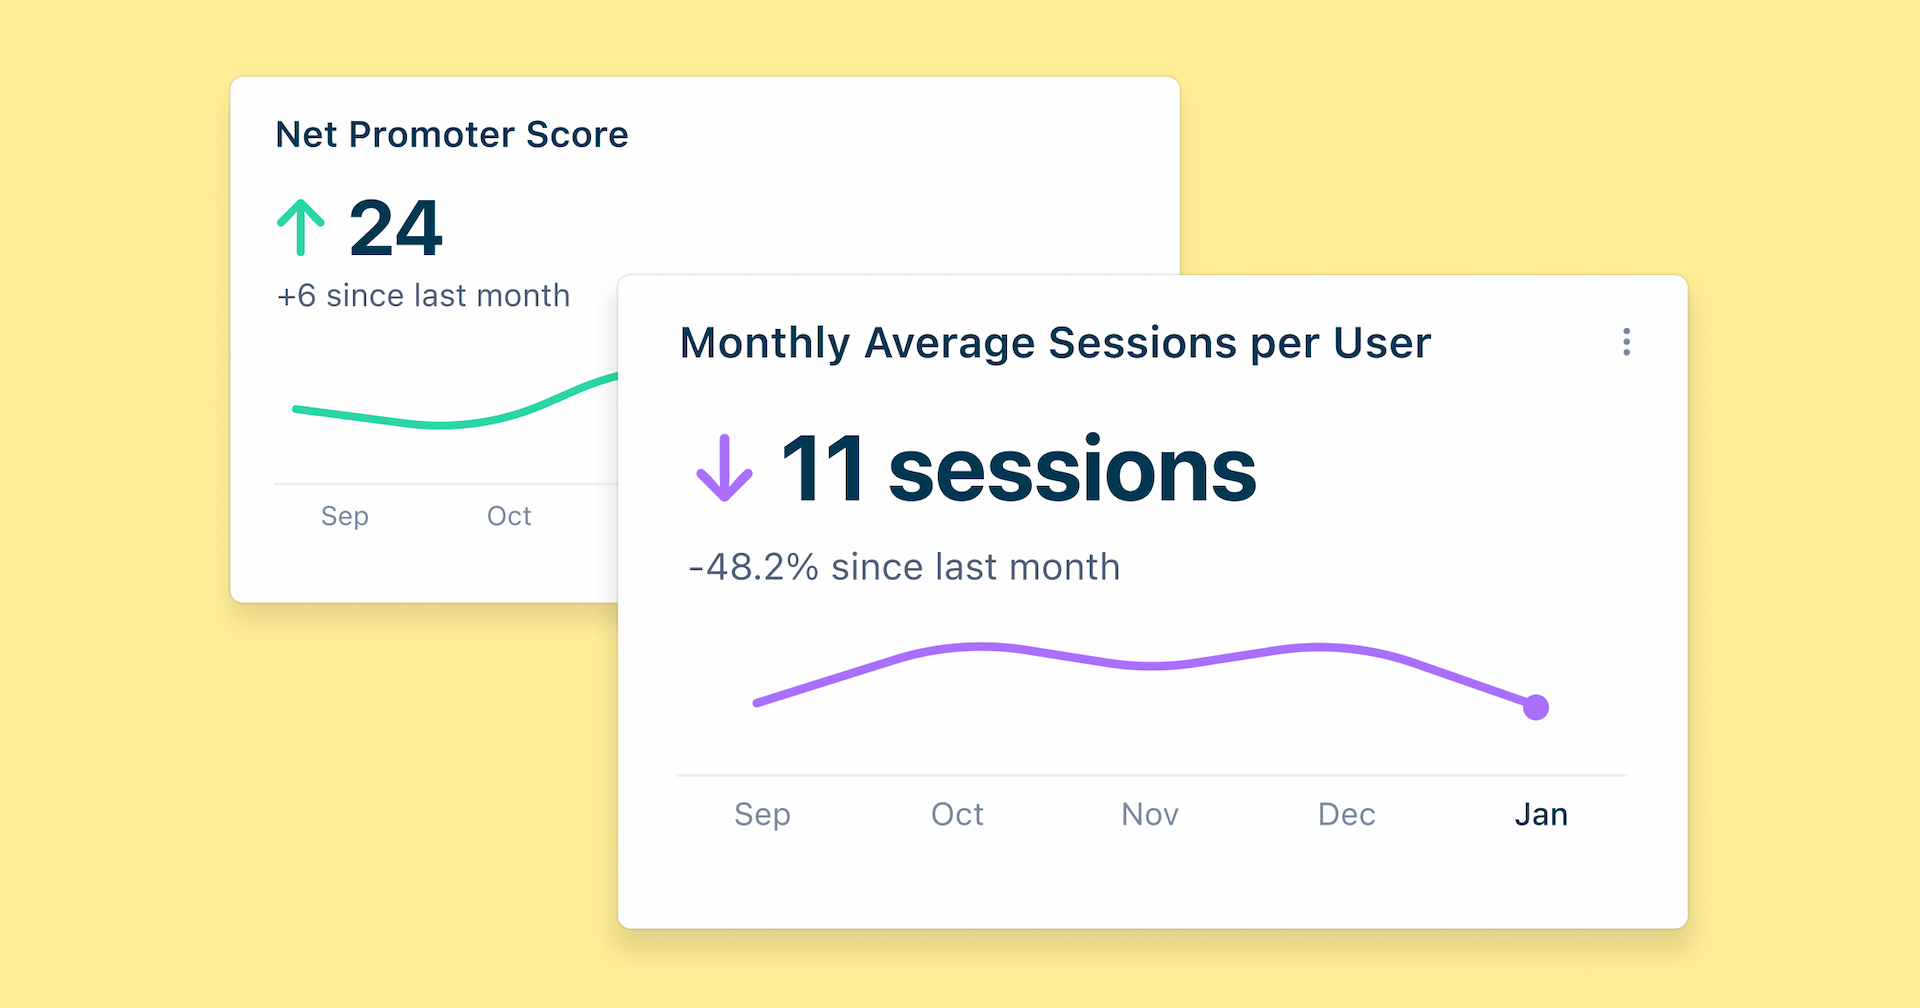
After assessing their needs, we built an Insightboard in Quantive to ensure the company could easily monitor the progress of their eNPS metric and understand the causes of survey responses.
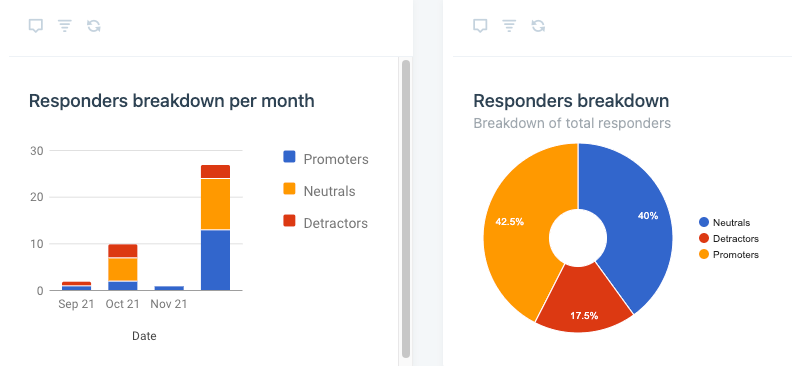
The team needed a graphical representation of the responses to understand the different types of responders, as well as any trends behind these responses. As a result, the following insights were created breaking down the responders into promoters, neutrals, and detractors.
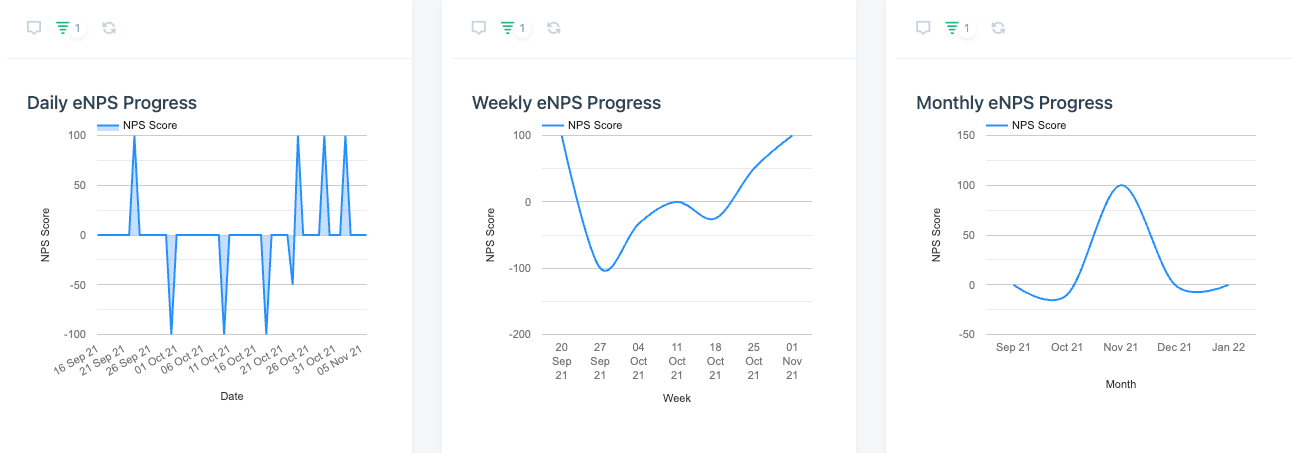
The ability to see the progress of the eNPS metric over time was of paramount importance also to the customer. As such, 3 Insights were created to showcase the progress of the daily, weekly, and monthly eNPS, providing multiple views into trends on a macro and micro level.
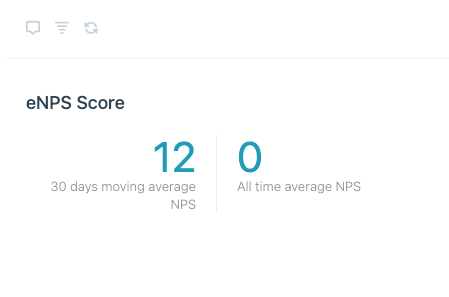
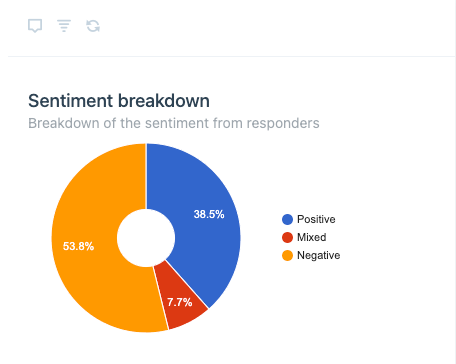
To understand the overall sentiment, we built an Insight that breaks down all responses into a summary perception of the company, whether positive, negative, or mixed,
The outcome
With the above graphical representations of sentiment, this company was able to track, action, and measure the impact of initiatives on employee wellbeing, noting where they were successful, invertedly decreased positive sentiment, or were affected by things outside of their control, like ‘Blue Monday’.
What started off as a need for visibility, snowballed into a culture of proactivity when it came to employee engagement, with management taking active steps to improve wellbeing, transparent sharing of eNPS as a KPI with employees, and the creation of OKRs which directly addressed any failings in improving this KPI.
Quantive empowers modern organizations to turn their ambitions into reality through strategic agility. It's where strategy, teams, and data come together to drive effective decision-making, streamline execution, and maximize performance.
As your company navigates today’s competitive landscape, you need an Always-On Strategy to continuously bridge the gap between current and desired business outcomes. Quantive brings together the technology, expertise, and passion to transform your strategy from a static plan to a feedback-driven engine for growth.
Whether you’re a visionary start-up, a mid-market business looking to conquer, or a large enterprise facing disruption, Quantive keeps you ahead — every step of the way. From OKR software to OKR consulting, we help you plan and meet your goals. For more information, visit www.quantive.com.