This AdTech company had a substantial obstacle reporting on the progress of their Engineering team on weekly basis, including insights into ongoing and blocked tasks. Quantive created a custom integration to connect their OKRs to Jira task progress.
The challenge
The Engineering team uses custom issue types in Jira to keep track of the major items they are working on as well as to differentiate the type of tasks and initiatives. Due to their unique issue types in Jira, this company faced several challenges in finding a flexible OKR software that offered out-of-the-box metrics alongside their custom requirements. Their initial fix was an excel file that showed:
- Items delivered during the week
- Items in progress with estimated delivery date
- Backlog items
Whilst their initial fix contained all the information needed for progress reports, it lacked connectivity to their OKRs, which entailed more manual work to join the data, progress could not be reviewed mid-week before the export, leading to delays in gaining insights, and only the Engineering team had access to this data. The final downside of excel was the limitations around data visualization. The team either had to limit themselves to line, bar and pie charts within excel itself or had to use an additional tool, such as Tableau or Data Studio, to fit this requirement, adding additional steps to an already lengthy OKR process.
The solution
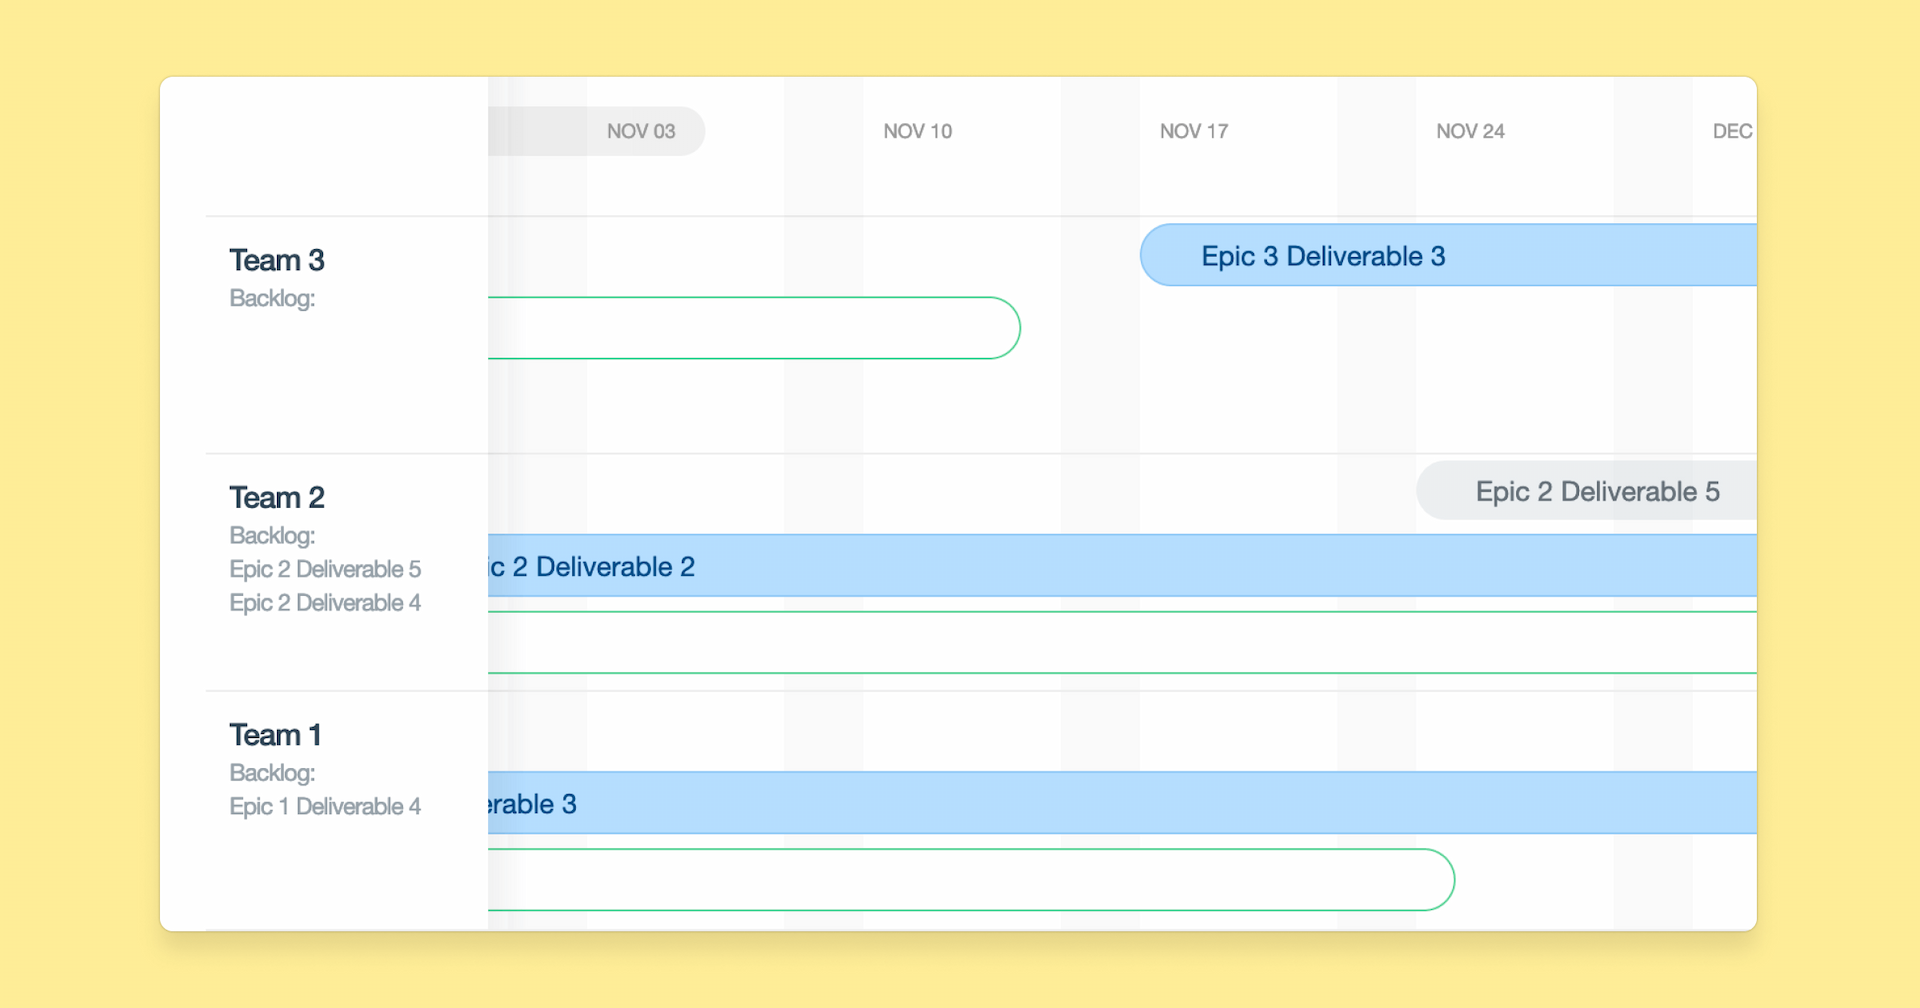
The first step was understanding our customer’s requirements. What they didn’t want is a boring Kanban view of tickets and instead wanted a Gantt chart that fully replicated their product roadmap view. Having gathered the requirements, our Technical Success team swiftly built out a Gantt View of progress.
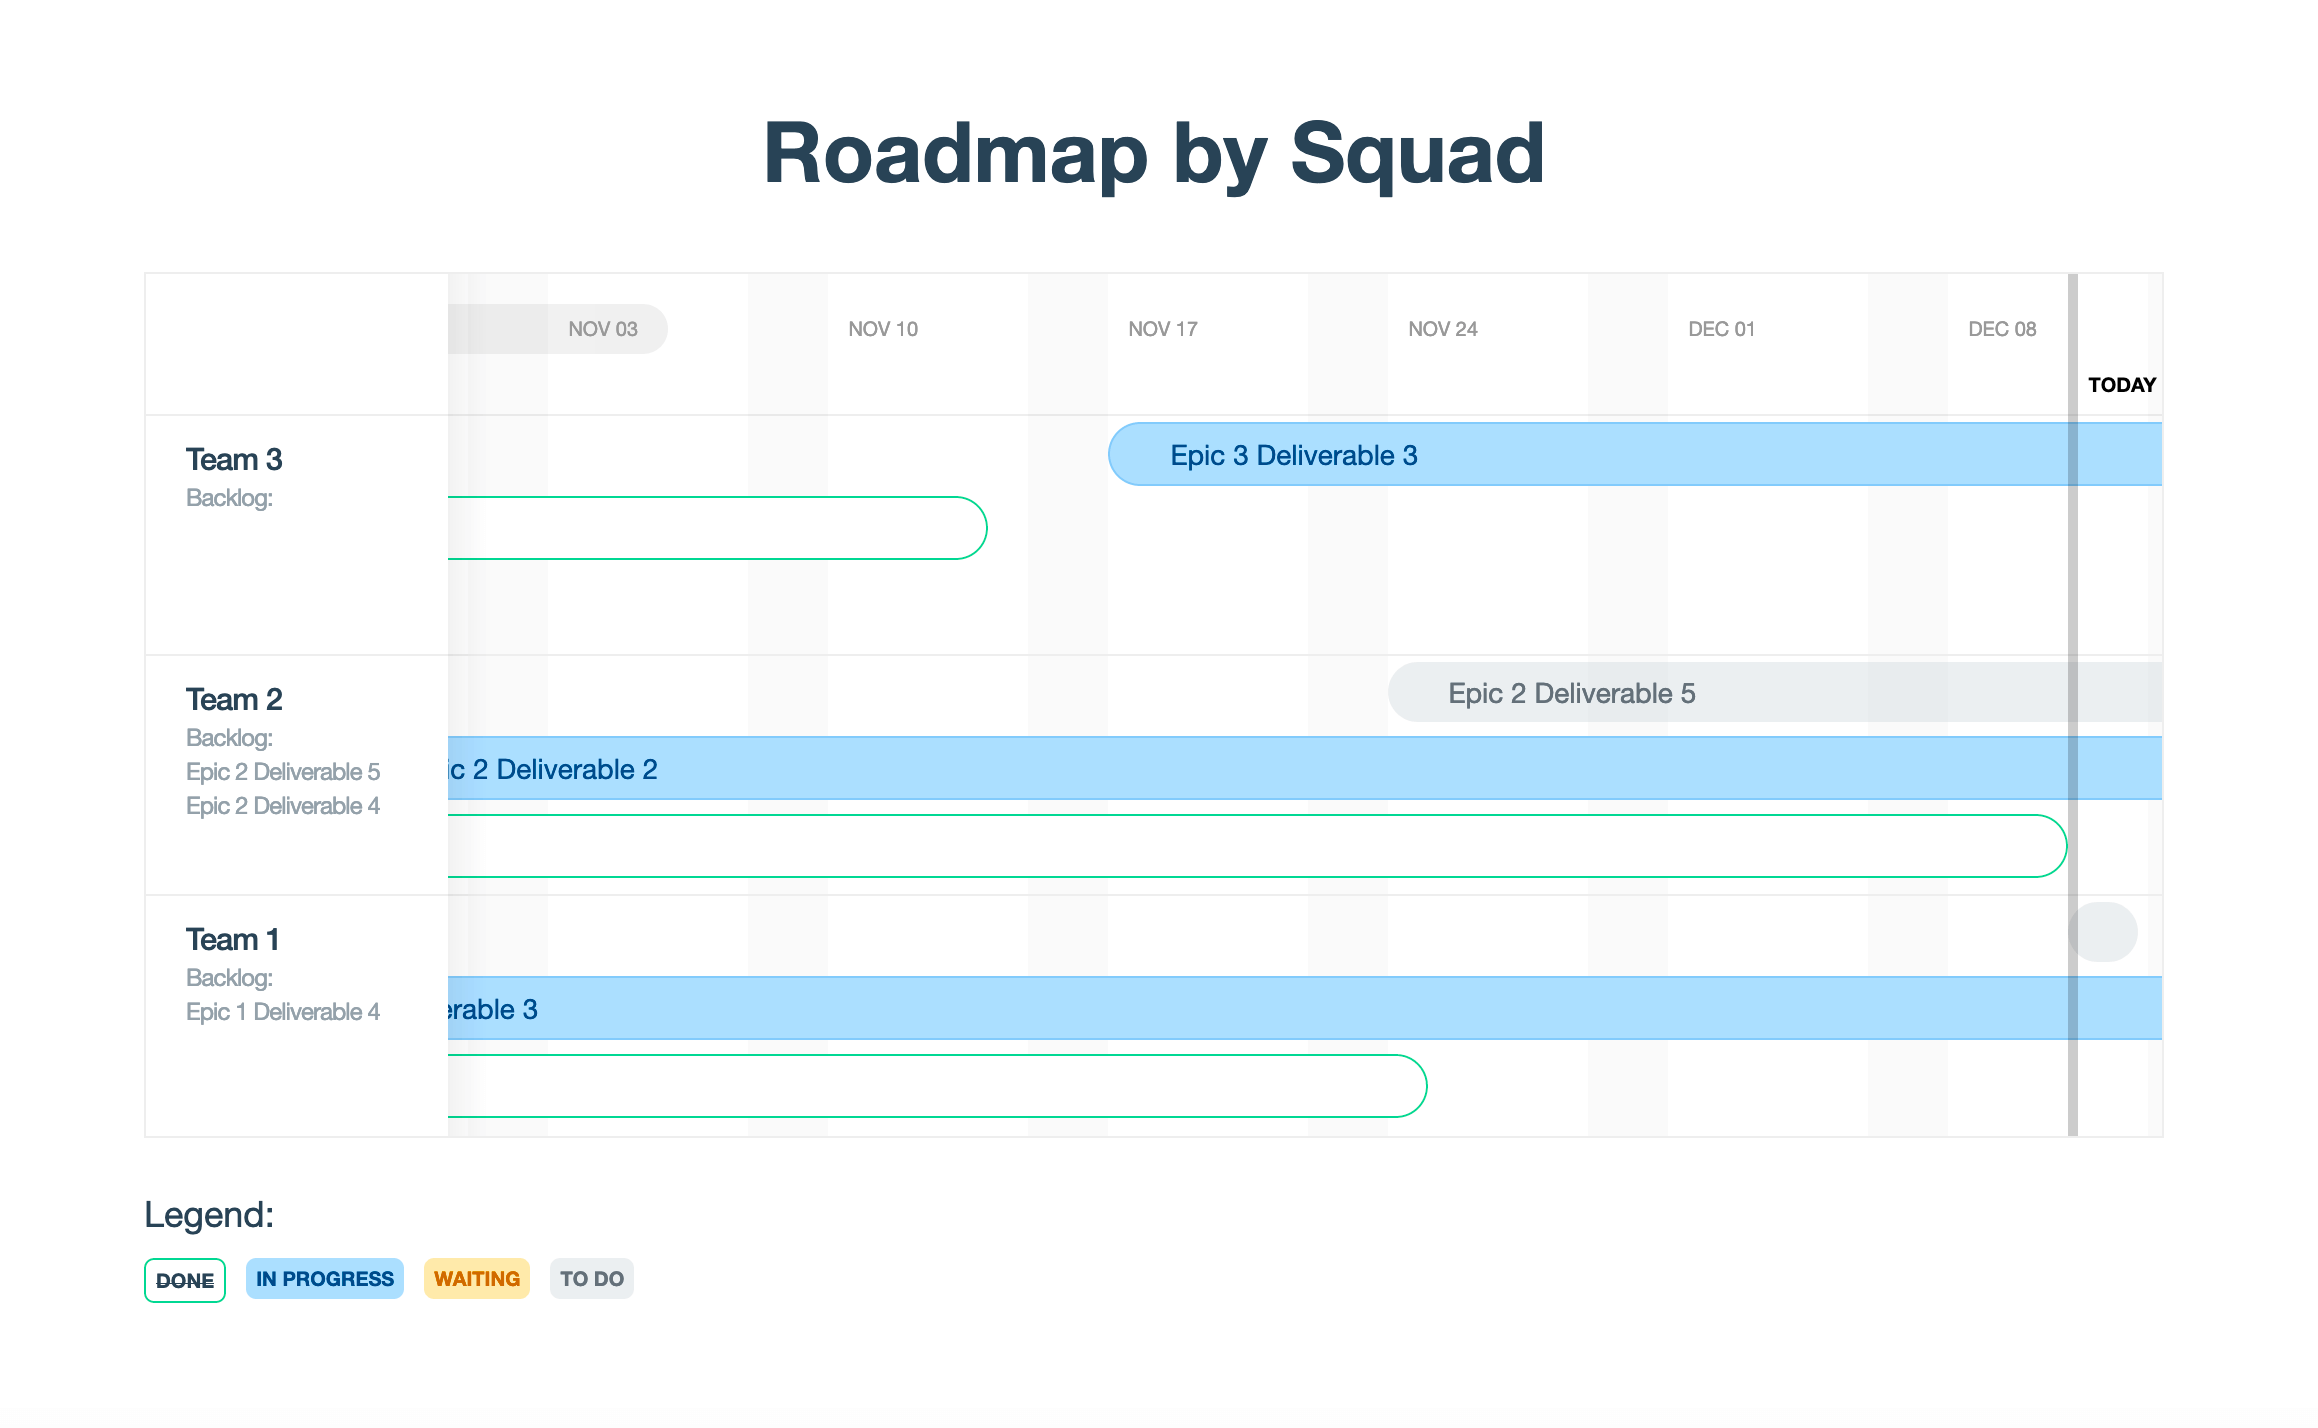
The view shows the deliverables that are currently in the roadmap for each team or squad and their estimated delivery time. Clicking on each item on the timeline view displays a popup box with more information and the option to go directly into Jira for further details. The items in the backlog can also be found summarized under each team on the left.
This benefit of having the ability to see progress from a top-level, but with the flexibility to dig directly into Jira data, meant that engineering teams and interested stakeholders can see at any time the information they need. For product managers and product marketers, this information is critical for communicating the progress of items to customers and other parties.
The outcome
Our solution saved the customer many business hours in preparation for this weekly report, getting the latest status from Jira and putting it in excel in the desired format. In addition, the live report in Quantive automatically updates when any change in Jira happens. This allowed the engineering team to continue to keep track of their work in Jira, with the added benefit of being exportable to pdf, for meetings, or to share live links with any Quantive users.
Quantive empowers modern organizations to turn their ambitions into reality through strategic agility. It's where strategy, teams, and data come together to drive effective decision-making, streamline execution, and maximize performance.
As your company navigates today’s competitive landscape, you need an Always-On Strategy to continuously bridge the gap between current and desired business outcomes. Quantive brings together the technology, expertise, and passion to transform your strategy from a static plan to a feedback-driven engine for growth.
Whether you’re a visionary start-up, a mid-market business looking to conquer, or a large enterprise facing disruption, Quantive keeps you ahead — every step of the way. From OKR software to OKR consulting, we help you plan and meet your goals. For more information, visit www.quantive.com.