
This month, we’re introducing major improvements designed to make tracking strategy execution more seamless, intuitive, and actionable. From a unified reporting hub to a redesigned KPI management experience, May’s updates focus on giving teams greater visibility and control to drive outcomes.
Find every insight in one place
All reporting capabilities—Performance and Process reports, Lists, and Insightboards—are now consolidated into a single "Reports" navigation section. The standalone Insightboard section has been removed from the main menu, simplifying access and organization.

Why it matters:
- Streamlines navigation, allowing faster access to insights
- Centralizes reporting workflows for greater usability
- Reduces complexity for users managing multiple types of reports
Smarter KPI management—without the spreadsheet pain
The KPIs module has been completely revamped to deliver a more powerful, flexible, and user-friendly experience. Updates include improved visualization, dynamic filtering and sorting, shareable KPI views, better tag-based organization, and enhanced permission management.

Why it matters:
- Adapts to changing business needs with flexible KPI grouping and customization
- Simplifies how users monitor and manage KPIs across teams and initiatives
- Reduces time spent importing, organizing, and maintaining performance data
- Strengthens KPI integration across reports, whiteboards, and home screen widgets
Clearer KPI insights, faster decisions
The redesigned KPI Detail screen introduces an updated chart experience, improved statistical tracking, clearer data projections, and easier inline editing of KPI properties.
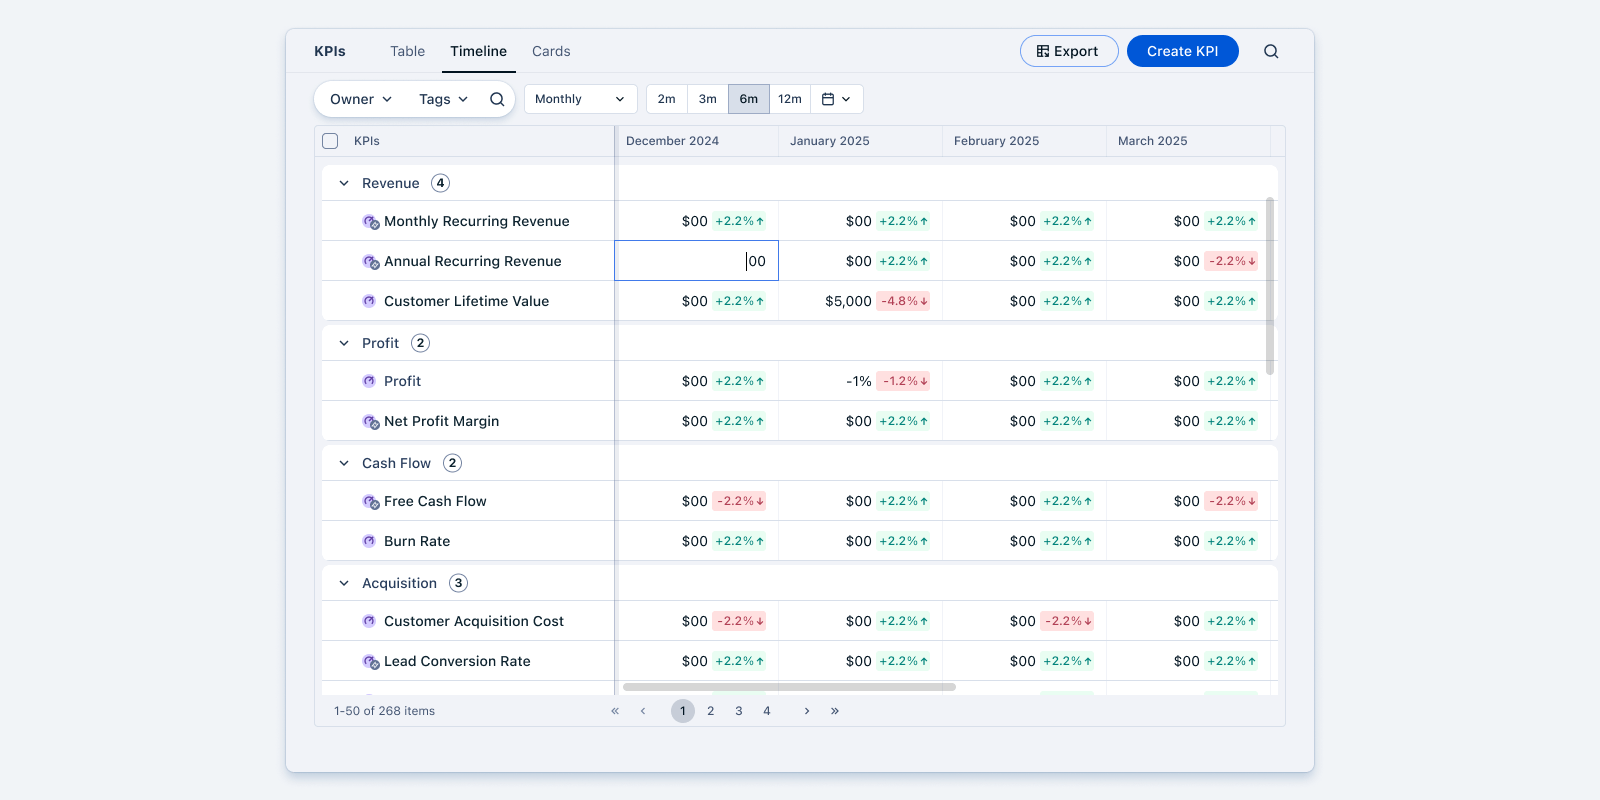
Key enhancements include:
- New static chart with adjustable aggregation and period settings
- Improved statistics showing progress-to-date and target status
- In-line editing of KPI fields for quicker adjustments
- New "Targets" tab to manage all KPI targets in one view
Why it matters:
- Delivers clearer performance insights at a glance
- Enables faster decision-making with actionable, easy-to-read data
- Helps teams stay aligned on what success looks like and where adjustments are needed
Keep strategy top-of-mind, right from your homepage
The Top-Level OKR Widget is now available and can be enabled by admins for users. This home screen widget brings company-level, team-level, and individual OKRs front and center, making alignment visible at a glance.
Learn more: How to customize My OKRs Widget
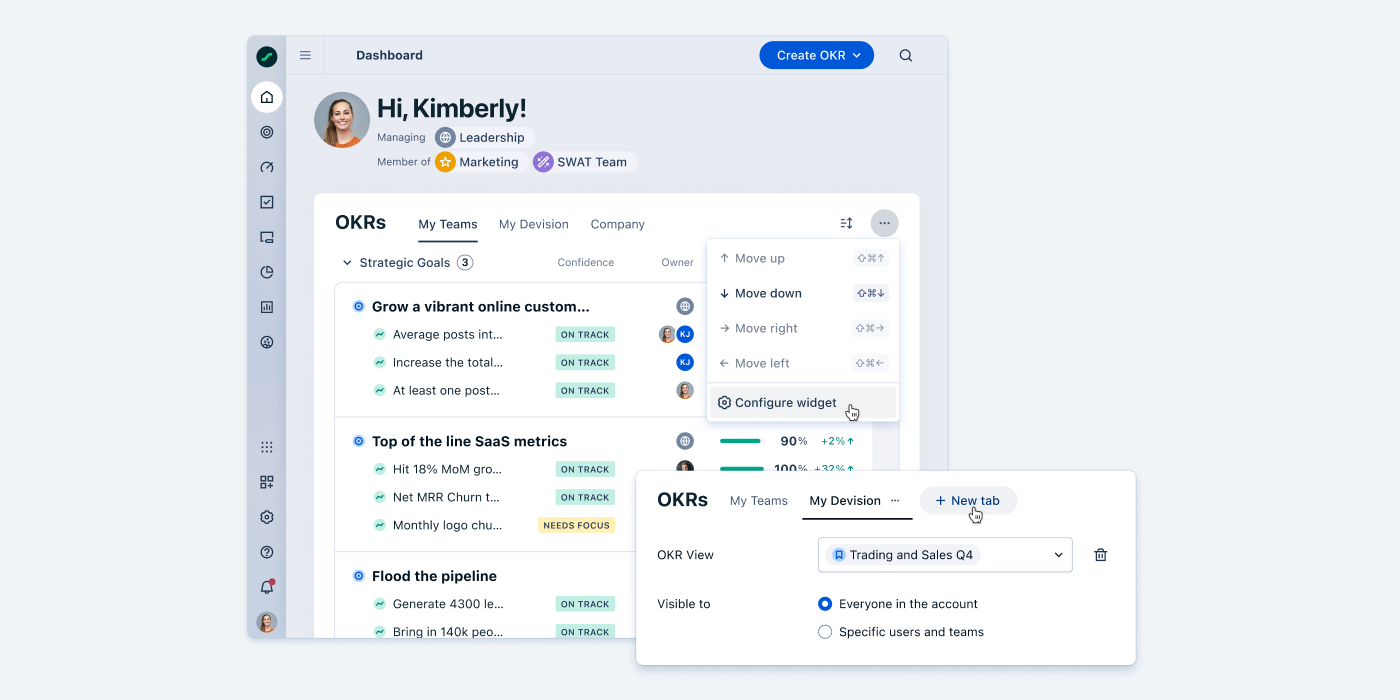
Key features:
- Multi-tab views for personal, team, and company OKRs
- Permission and visibility controls for role-specific access
- Customization options to rename, delete, revert, and save widget views
Why it matters:
- Keeps strategic priorities highly visible for all users
- Enhances cross-team transparency and operational alignment
- Reduces time spent navigating to find OKR data
- Provides customizable visibility and access based on user roles
Closing Thoughts
May’s updates continue our commitment to making Quantive the central source of truth for strategic planning, execution, and measurement. By enhancing reporting, KPI management, and strategic visibility, we’re helping organizations stay aligned, agile, and results-driven.


